Chapter 4: Understanding the Property Market
This is an extract from the ebook How to Really Buy a Property.
What's covered in this chapter
- Property prices since 1975;
- What drives property prices apart from salaries;
- What will happen to property prices over the long term;
- What is happening to the supply of new properties;
- The likely effects of Brexit and Covid 19
- The difference between national and regional property markets;
- How real property prices actually rise and fall every year;
- When you should shop for a bargain and when you should shop for choice;
- How you can end up trapped in the property search;
- When you should buy.
It is amazing how many people delay buying because they believe the market is falling, or rising too fast, or the market is steady and so may fall, and so on. In their defense they are encouraged to do so by the media which loves to paint all price rises as worrying and all price drops as the possible start of something bigger.
Friends, family and work colleagues are also very keen to offer their analysis, often based on that very same media. It would be interesting how many of these advisers would be interested in knowing what Estate Agents, Solicitors and Surveyors forecast for the industries that they work in!
How the market acts is actually surprisingly simple, but it is perhaps this simplicity that does not lend itself particularly well to headlines. It is crucial therefore to understand that:
- The current trend is for prices to continue to move up due to increasing demand for property and restrictions in new supply.
- Regionally markets move up and down all the time but this is rarely reported.
- The market has a traditional cycle that means that prices do move down quite regularly, usually twice a year.
The Current Trend in the National Property Market
The amount of land available to build on is restricted and the number of people who want to live in the UK is continuing to increase. One overriding principle to remember, in London, is that property prices have risen, almost continuously, since the end of the Second World War. In some parts of the city they have doubled every ten years over this period.
And the simple issue of supply and demand is expected to get worse. As of 2021 it is estimated that, for example, London needs 94,000 new homes to be built every year but only about a third of this is ever managed. Way back in October 2012 the Future Homes Commission concluded the UK as a whole needed 300,000 - 330,000 new homes every year. And how many were built in 2012? Just 128,600.
In the following decade new homes struggled to even breach 200,000 units.
Despite this well known trend the situation is likely to be exacerbated by moves such as the continued introduction of more conservation areas, the protection of green spaces and ever rising immigration.
It can be argued these go far towards improving quality of life. Protecting open spaces gives us places in which to spend our recreational time. Immigration provides us with a richer and more cosmopolitan mix of cultures which broaden our horizons. But ironically they also make the country an even more desirable habitat and increase property demand still further.
The graph below demonstrates the problem by showing the decrease in the number of new homes being built over the last forty years:
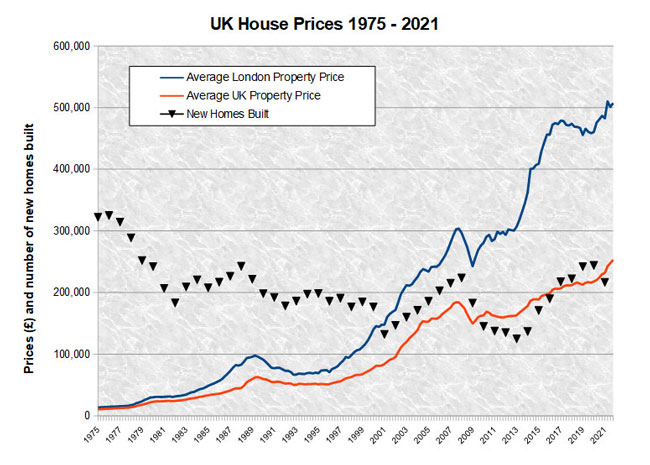
Property prices: Land Registry. New homes built: GOV.UK - Net Supply of Housing
The credit crisis has decreased the number of new dwellings still further as construction companies struggled to raise finances for projects. This drop can clearly be seen in the graph above and was especially acute in the South East of England where the number of additional dwellings dropped by 32% in the financial year 2009-2010.
Furthermore this annual reduction seems to have become permanent since the credit crisis. 2013 saw 118,540 new dwellings completed. At no time since 1975 have more homes been in demand and so few built.
2015 offers a glimmer of hope but at 155,080 new dwellings completed this still remains half the volume required according to the Future Homes Commission.
We also need to factor into this the effects of migration to the United Kingdom. This is has been consistent at around 250,000 since the turn of the millennium (according to the Office of National Statistics).
That's five times larger than the 1990s and Brexit has done nothing to change this. That's 250,000+ new people a year while the UK builds around 200,000 new properties every 12 months.
Some of these will be looking to stay and buy, others are migrant workers which increase demand for rental properties (and so buy-to-let investment demand) while some are foreign investors who see purchasing UK bricks and mortar as a safe haven for their funds.
So while the number of new homes built last year might be up, the number of people who want to live in them is also on the rise.
In summary we have a situation where England and Wales are short of homes and the population is growing faster than they can be built.
There is an alternative measure published by gov.uk which looks at the Net Additional Dwellings. This takes into account not just new build completions but also demolitions, conversions and changes of use (such as from commercial to residential).
This data has been collected since 2004 in which year there were 185,550 additional dwellings created in England. The number peaked at 223,530 in 2008 before sinking to a record low of 124,720 in 2013. 2015 shows a marked improvement at 170,690 but still far too little.
To put this in some perspective over the last decade the number of additional dwellings has grown by nearly 2 million while the UK population has swelled by some 5 million and all this happened in a country that was already short of housing in 2004.
The rise of One Person Households
As if what I've discussed so far is not enough the population of the UK is actually adding to the property strain as increasing numbers of people decide to live alone.
That's the end of the free preview ...
You can get the rest of this chapter,
and all the others, when you
purchase the ebook How to Really Buy a Property
and all the others, when you
purchase the ebook How to Really Buy a Property